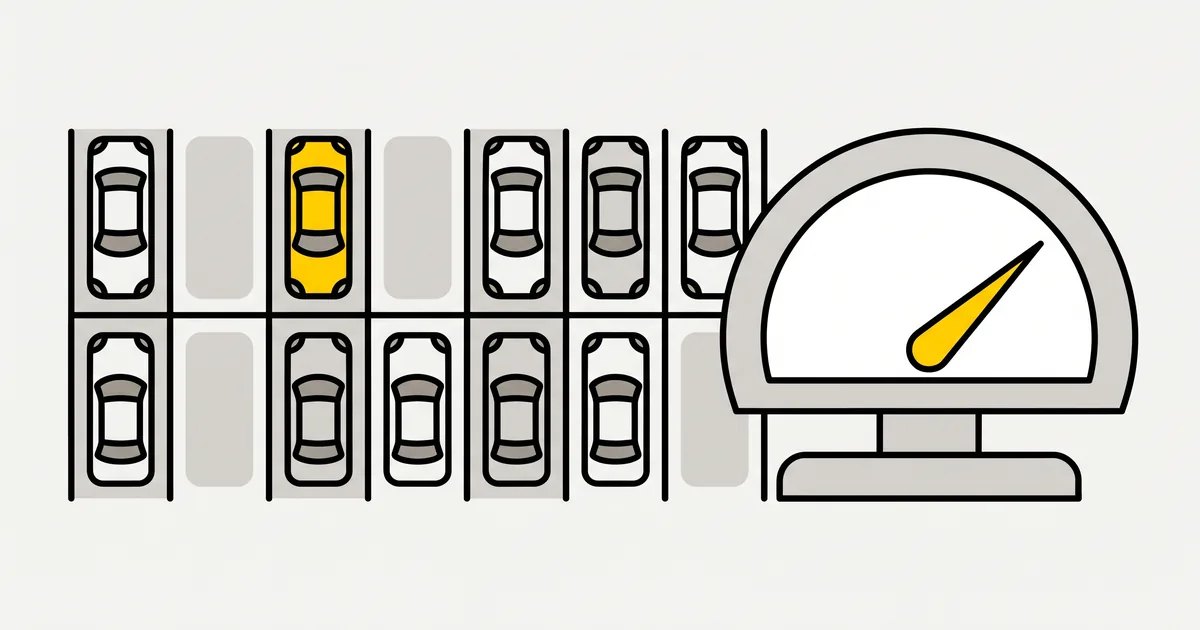
Short answer: Fleet utilization rate is the share of the days your cars could have been rented that they actually were: rental days ÷ available car days × 100. Hertz, one of the few rental companies that publishes the figure, reported 81% for 2025 on that definition. Measure yours the same way every month, by car and by class, and read it next to revenue per available car so you do not buy utilization with discounts.
Search for "fleet utilization rate" and you will find formulas that disagree, benchmarks with no source, and at least one method that produces utilization above 400%. This guide gives you one definition you can defend, a worked example with a 12-car fleet, and the levers that move the number.
Key takeaways
- The formula is simple; the two decisions inside it are not. Decide what counts as a rental day and which cars count as available, then never change the rule mid-year.
- Exclude cars you are selling. Hertz removes vehicles held for sale from its available fleet, and so should you.
- Keep cars in the workshop in the denominator. Days lost to repairs are exactly what utilization should expose.
- Utilization is seasonal. Hertz reported 81% for the full year 2025 but 78% in the fourth quarter.
- Track revenue per available car alongside it. It is the metric that tells you whether higher utilization made you money.
The formula, and the two decisions it hides
Fleet utilization = rental days ÷ (rentable cars × days in the period) × 100
That is how Hertz defines it in its 2025 fourth-quarter earnings release: transaction days divided by available car days, where available car days are average rentable vehicles multiplied by the days in the period.
Decision 1: what is a rental day?
Hertz counts every 24-hour period on rent as a transaction day, and any partial period counts as one. A car returned at 10:00 and rented again at 14:00 can therefore earn more than one transaction day in a single calendar day. Some small operators prefer calendar days instead: a car on rent at any point on a date counts once for that date. Either works. Pick one and apply it to every car.
Decision 2: which cars are available?
| Car status | In the denominator? | Why |
|---|---|---|
| Ready to rent, parked | Yes | This is idle capacity you paid for |
| On rent | Yes | The numerator counts it too |
| In the workshop or waiting for parts | Yes | Repair time is a real utilization loss you want to see |
| Held for sale or being sold | No | Hertz excludes these; they are no longer rental capacity |
| Not yet delivered or registered | No | You cannot rent it yet |
| Written off after an accident | No, from the date of the loss | It has left the fleet |
If you prefer to see utilization of cars that were ready to go, calculate a second figure that also removes workshop days. Call it "ready-fleet utilization" and keep it separate so nobody confuses the two.
Four metrics that belong together
| Metric | Formula | What it tells you | What it hides |
|---|---|---|---|
| Fleet utilization | rental days ÷ available car days | How busy your rentable fleet is | Whether the rentals were priced well |
| Ready-fleet utilization | rental days ÷ (available car days − workshop days) | How well you sell the cars that are ready | Time lost to repairs |
| Average daily rate | rental revenue ÷ rental days | What a rental day earns | Empty days |
| Revenue per available car day | rental revenue ÷ available car days | The combined result: price × utilization | Which of the two moved |
Revenue per available car day equals average daily rate multiplied by utilization. It is the one to watch when you discount to fill cars, because it falls if the discount costs more than the extra days bring in. Hertz reports a monthly version, total revenue per unit per month, which was $1,385 for 2025.
Worked example: a 12-car fleet in a 30-day month
Here is a month at a small independent operator:
- 12 cars on the books; one is listed for sale all month, so 11 cars are rentable.
- Two of the rentable cars spent 6 days each in the workshop: 12 workshop days.
- Bookings produced 236 rental days and $13,800 of rental revenue.
| Figure | Calculation | Result |
|---|---|---|
| Available car days | 11 cars × 30 days | 330 |
| Fleet utilization | 236 ÷ 330 | 71.5% |
| Ready-fleet utilization | 236 ÷ (330 − 12) | 74.2% |
| Utilization counting the car for sale | 236 ÷ 360 | 65.6% |
| Average daily rate | $13,800 ÷ 236 | $58.47 |
| Revenue per available car day | $13,800 ÷ 330 | $41.82 |
| Revenue per rentable car per month | $13,800 ÷ 11 | $1,255 |
Three readings of the same month range from 65.6% to 74.2%. That is why the rule matters more than the formula. Use 71.5%, the Hertz-style figure, as your headline, and keep the ready-fleet figure as the workshop check.
The per-car view
The fleet number hides the cars that drag it down. Five of the eleven rentable cars from the example:
| Car | Rental days | Workshop days | Revenue | Utilization | Revenue per available day |
|---|---|---|---|---|---|
| Compact A | 27 | 0 | $1,566 | 90% | $52.20 |
| Compact B | 25 | 0 | $1,375 | 83% | $45.83 |
| SUV C | 22 | 0 | $1,694 | 73% | $56.47 |
| Compact D | 15 | 6 | $840 | 50% | $28.00 |
| Saloon E | 12 | 0 | $660 | 40% | $22.00 |
The SUV earns the most per available day despite lower utilization, because its rate is higher. Car D's problem is the workshop: fix the repair process before you blame demand. Car E has no repair excuse: either reprice it, move it to longer rentals, or sell it and replace it with something renters want.
What is a good utilization rate?
There is no honest single benchmark for small fleets, and the round numbers you see quoted rarely come with a source. What you can use:
- A public reference point: Hertz's 81% for 2025, measured as above, with a seasonal dip to 78% in the fourth quarter. A national brand with airport counters is not your peer, so treat it as an upper reference.
- Your break-even: the utilization at which your rates cover your costs. Our car rental KPIs guide shows how utilization fits with the rest of your numbers.
- Your own trend: the same month last year, by class.
If your utilization is high but revenue per available car day is falling, you are probably underpriced. If utilization is low across every class all year, the fleet is probably too large for your demand.
Nine ways to raise utilization
- Cut turnaround time. Inspect, clean and check fuel or charge within a set time so a returned car is bookable again the same day.
- Move maintenance to slow days. Book services midweek and in the low season, and track them by mileage and date so nothing surprises you.
- Shorten repair delays. Agree turnaround times with one body shop and one mechanic; measure workshop days per car.
- Sell the weakest car each quarter. Rank cars by revenue per available day and replace the bottom one with the class that sells out.
- Use weekly and monthly rentals in the low season. They fill the calendar with fewer turnarounds.
- Set minimum rental lengths at peak. A two-day minimum on a holiday weekend stops one-day rentals blocking longer ones.
- Add channels without double-booking. Your own website, a marketplace, insurance replacement and corporate accounts fill different days, but only if one calendar controls every car.
- Price by season and weekday. Raise rates when you sell out early; lower them where cars sit empty.
- Close the gaps between bookings. A fixed buffer for cleaning is good; an accidental half-day gap on every return is not.
Your monthly utilization review
- Export rental days and revenue per car for the month.
- Mark cars for sale and new arrivals with the dates they left or joined the rentable fleet.
- Record workshop days per car.
- Calculate fleet, ready-fleet and per-car utilization, plus revenue per available car day.
- Compare with the same month last year and with your break-even utilization.
- Decide one action per bottom-three car: reprice, repair, re-channel or sell.
Our guide to reporting and analytics covers how to build this into a monthly routine.
Where CarCEO helps
CarCEO keeps bookings from every channel, maintenance blocks and imported calendar blocks on one calendar per car, so the rental days in your numerator come from a single source. In Financials, Fleet Finance shows each car's revenue, costs, profit and utilization, where utilization is measured as rented days divided by days since you bought the car. That lifetime figure is the right one for "should I keep this car?". For a single month or season, export your bookings to CSV and apply the formula above.
Live Ops shows how many cars are on rent right now, and maintenance schedules by distance, engine hours or days help you plan services for slow days. For the wider fleet side, see fleet management software for car rentals.
Keep reading: how to set a break-even daily rate and the seasonality playbook.
FAQ
How do you calculate fleet utilization for car rental?
Divide rental days by available car days, then multiply by 100. Available car days are the number of rentable cars multiplied by the days in the period. Exclude cars held for sale; keep cars in the workshop in the count.
What is a good fleet utilization rate?
Hertz reported 81% for 2025 using this definition, with 78% in the fourth quarter. Small independents rarely have airport demand, so set your target from your own break-even and last year's figures rather than from a round number.
Can utilization be more than 100%?
At the level of one car and one day, yes, if you count every partial 24-hour period as a rental day and turn the car around the same day. Across a fleet and a month, a figure above 100% usually means the counting rule is wrong.
Should cars in maintenance count as available?
In the main figure, yes. Workshop time is lost capacity, and hiding it makes slow repairs invisible. Track a second "ready-fleet" figure without workshop days if you want both views.
Is high utilization always good?
No. Utilization bought with deep discounts can lower revenue per available car day. High utilization with no free cars also means turning away bookings that would have paid more. Watch both numbers together.
See every car's revenue and utilization in one place: start free with CarCEO, or compare the plans.